KaosMaster
Senior Member
Hello DroidForums Members!
This guide is to assist everyone in "HOW TO" use and understand the information provided inside the Android OS Battery Statistics menu! This will help everyone to understand a uniform set of facts, and assist us all in finding the truth about how much battery a component is actually using on a given device, and if necessary identify issues within the given device!
I will not be explaining how the math works exactly, just providing the Correct Equations to achieve the results! In Math, 15 minutes would be 0.25, 30 minutes is 0.50, and 45 minutes is 0.75. There is a more precise breakdown of "HOW TO" convert time into 'Decimal Values' if you want to research and learn from the web!
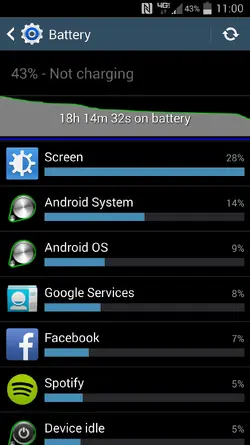
This is the Battery Statistics display from within the Android OS:

As you can see at the top of the display, it shows TWO (2) VITAL pieces of Information! The first, is that the Device is at 43%, and is not plugged in. This means that the Device has USED 57% of the Battery charge already. The second is that the Device has been "ON" battery for (approximately) 18 HOURS and 15 MINUTES. This is actually a "GRAPH" bar, and behind the 'Time on battery' you will see a grey graph. This shows how slow or fast your device discharges the battery.
To 'Calculate' how much battery is used, using these TWO (2) factors would be completed like this:
First 'Convert' the percentage (%), of the USED battery, to a 'Decimal Value', you complete this by moving the Decimal point TWO (2) places to the LEFT.
57% would be 0.57 in mathematical terms.
Second, Divide the 'Decimal Value' by the 'Time'.
0.57 / 18.5 = 0.0308108
Now, ~Convert~ the 'Answer' back to a Percentage (%) [Move the 'Decimal Point' TWO (2) places to the RIGHT]:
0.0308108 = 03.08108% = 3.08%
This shows that the Device used 3.08% of the Battery for every ONE (1) HOUR the Device has been "ON" battery. This is your baseline to follow for Device Power Consumption, and to monitor any changes in battery life!
NOW, we come to the fun part!!
Below the "Time Graph" is a list of the "Components" of the Operating System (OS) that is using the battery, and how much each item has used in the form of a percentage (%). The 'Percentage Value' you are looking at is actually a Percentage of the USED 57% from the first math equation we performed!
You can see, in the image, that the first "Component" listed is the "SCREEN". The image shows that the "SCREEN" used 28% of the Battery. In actuality, the Screen USED 28% of the 57% of the Battery that has been drained!!!
This percentage is ~NOT~ 28% of the 43% displayed!!!! This is a crucial aspect to understand!!
So, if we want to know how much power was used by the "SCREEN" from the battery. This would be obtained by 'Multiplying (*)' the percentage USED overall by the Percentage USED by the "Component". So, 57% and 28%:
0.57 * .28 = 0.1596
THEN, you 'Divide (/)' the 'Answer' by the "Time" you get:
0.1596 / 18.5 = 0.008627
Convert the 'Answer' back to a percentage (%), and you get 0.86%. This value shows that the "SCREEN" used approximately 1% for every HOUR the Device is "ON" of the Overall 3% Battery Usage. that means 2% is left. This shows that 1/3rd of the Devices power requirements is used when powering the Device's "SCREEN" alone!!!
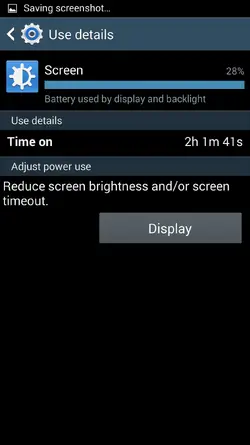
Now you can further find out more information by ~TAPPING~ on the "SCREEN" entry in the list. It will open a new display that shows the following information:

As you can see, this now shows you the amount of "Time" the "Component" was actually "ON" or "In Use". So you can 'Track' the actual percentage of the "Component" using the same equation as before, just change the "Time" from 'Overall' to the specific "TIME" of the individual "Component":
0.1596 / 2 = 0.0798
This 'Answer' would be 7.89%. So for every (approximate) HOUR the screen is "ON" it is using 7.89% of the Overall Battery Usage.
These math steps can be used the same way for any 'Component" that is Listed. You can then further break down how each "Component" behaves as your Device "DISCHARGES"!
SO in conclusion:
In (approximately) ONE HOUR, the Device pictured used 3% of the Overall "CHARGE" of the battery to 'Power' the Device. The "SCREEN" used 1% of the 3%. And the "SCREEN" requires 7.89% of the Battery to "OPERATE" for 1 HOUR!!!
I hope this helps everyone to understand the Uses and Information displayed inside the Battery Statistics Section! Once you understand, it will help to greatly see how each "COMPONENT" of the System affects your Battery Life!
I welcome any comments, or suggestions you all may have!
Thank you for your time, and reading this guide!!
I
This guide is to assist everyone in "HOW TO" use and understand the information provided inside the Android OS Battery Statistics menu! This will help everyone to understand a uniform set of facts, and assist us all in finding the truth about how much battery a component is actually using on a given device, and if necessary identify issues within the given device!
I will not be explaining how the math works exactly, just providing the Correct Equations to achieve the results!
This is the Battery Statistics display from within the Android OS:

As you can see at the top of the display, it shows TWO (2) VITAL pieces of Information! The first, is that the Device is at 43%, and is not plugged in. This means that the Device has USED 57% of the Battery charge already. The second is that the Device has been "ON" battery for (approximately) 18 HOURS and 15 MINUTES. This is actually a "GRAPH" bar, and behind the 'Time on battery' you will see a grey graph. This shows how slow or fast your device discharges the battery.
To 'Calculate' how much battery is used, using these TWO (2) factors would be completed like this:
First 'Convert' the percentage (%), of the USED battery, to a 'Decimal Value', you complete this by moving the Decimal point TWO (2) places to the LEFT.
57% would be 0.57 in mathematical terms.
Second, Divide the 'Decimal Value' by the 'Time'.
0.57 / 18.5 = 0.0308108
Now, ~Convert~ the 'Answer' back to a Percentage (%) [Move the 'Decimal Point' TWO (2) places to the RIGHT]:
0.0308108 = 03.08108% = 3.08%
This shows that the Device used 3.08% of the Battery for every ONE (1) HOUR the Device has been "ON" battery. This is your baseline to follow for Device Power Consumption, and to monitor any changes in battery life!
NOW, we come to the fun part!!
Below the "Time Graph" is a list of the "Components" of the Operating System (OS) that is using the battery, and how much each item has used in the form of a percentage (%). The 'Percentage Value' you are looking at is actually a Percentage of the USED 57% from the first math equation we performed!
You can see, in the image, that the first "Component" listed is the "SCREEN". The image shows that the "SCREEN" used 28% of the Battery. In actuality, the Screen USED 28% of the 57% of the Battery that has been drained!!!
This percentage is ~NOT~ 28% of the 43% displayed!!!! This is a crucial aspect to understand!!
So, if we want to know how much power was used by the "SCREEN" from the battery. This would be obtained by 'Multiplying (*)' the percentage USED overall by the Percentage USED by the "Component". So, 57% and 28%:
0.57 * .28 = 0.1596
THEN, you 'Divide (/)' the 'Answer' by the "Time" you get:
0.1596 / 18.5 = 0.008627
Convert the 'Answer' back to a percentage (%), and you get 0.86%. This value shows that the "SCREEN" used approximately 1% for every HOUR the Device is "ON" of the Overall 3% Battery Usage. that means 2% is left. This shows that 1/3rd of the Devices power requirements is used when powering the Device's "SCREEN" alone!!!
Now you can further find out more information by ~TAPPING~ on the "SCREEN" entry in the list. It will open a new display that shows the following information:

As you can see, this now shows you the amount of "Time" the "Component" was actually "ON" or "In Use". So you can 'Track' the actual percentage of the "Component" using the same equation as before, just change the "Time" from 'Overall' to the specific "TIME" of the individual "Component":
0.1596 / 2 = 0.0798
This 'Answer' would be 7.89%. So for every (approximate) HOUR the screen is "ON" it is using 7.89% of the Overall Battery Usage.
These math steps can be used the same way for any 'Component" that is Listed. You can then further break down how each "Component" behaves as your Device "DISCHARGES"!
SO in conclusion:
In (approximately) ONE HOUR, the Device pictured used 3% of the Overall "CHARGE" of the battery to 'Power' the Device. The "SCREEN" used 1% of the 3%. And the "SCREEN" requires 7.89% of the Battery to "OPERATE" for 1 HOUR!!!
I hope this helps everyone to understand the Uses and Information displayed inside the Battery Statistics Section! Once you understand, it will help to greatly see how each "COMPONENT" of the System affects your Battery Life!
I welcome any comments, or suggestions you all may have!
Thank you for your time, and reading this guide!!
I
Last edited:

